What are these bits?
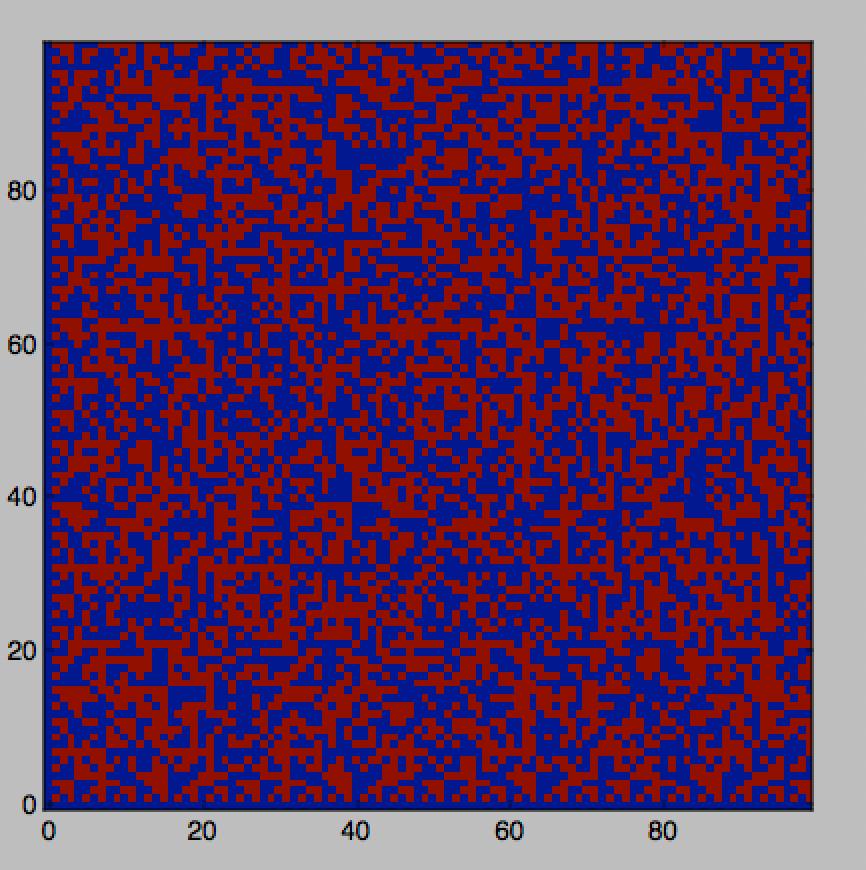
The picture is a little hard to examine, so those who want the grid in a more useful format can get a csv file here. The program used to generate it relies on my solution (which I hope is correct, but I haven’t manually or automatically compared every pixel).
Solution
Inspection reveals two interesting features of the pattern:
- The zeroth row and column are all blue.
- Each row (and each column), apart from the zeroth, exhibits a repeating pattern: the pattern up to but not including the pixel on the $m=n$ diagonal is followed by its inverse (the order is the same but the colors are switched), after which the original pattern and the inverse are repeated, and so on (again I confess that I did not take the trouble to check all of the rows and columns for this, but it seems to be true). It follows that the diagonal itself, apart from $(0,0)$, is composed of red pixels.
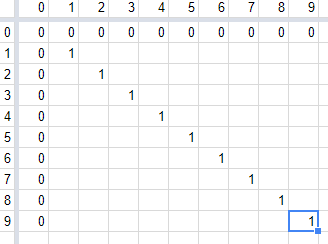
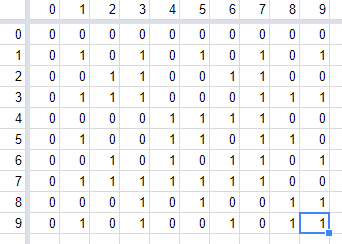
It turns out that these two features uniquely determine the entire pattern. Let’s see how. We’ll work in a spreadsheet where $(0,0)$ is at the top-left and where blue and red are replaced by $0$ and $1$. Start by filling in the edges and diagonal.
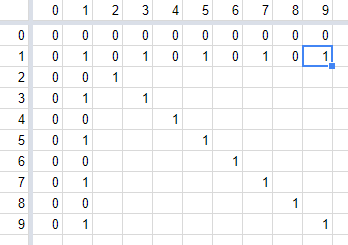
Looking at column $1$, we see that its initial pattern, up to but not including the diagonal, is already complete: it is simply $0$. Its inverse is also already complete: it’s the $1$ at $(1,1)$. So we repeat the pattern $0,1$ through the rest of column $1$, and we do the same for row $1$:
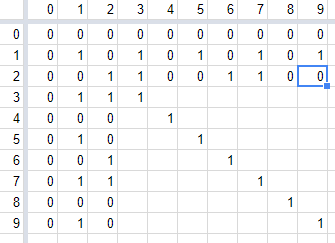
Now we see that the initial pattern for column $2$ is complete: it is $0,0$. So we continue with its inverse, namely $1,1$ and then repeat the pattern $0,0,1,1$ throughout the column and corresponding row:
You get the idea: this can be repeated for every row and column, to determine the value of every pixel in the grid. When we’ve completed the $n$th row and column, we have all of the $n+1$st row and column up to the diagonal; so we know its base pattern, which we complete with its inverse and finish the row and column by repeating the base and inverse patterns.
Mathematically, we can represent the pattern as a recurrence. Let $f(m,n)$ be the value of the pixel at $(m,n)$. Then:
- $f(m,0) = f(0,m) = 0$ for all $m$
- $f(m,n) = 1 - f(m,n-m)$ for $n \geq m$
- $f(m,n) = 1 - f(m-n,n)$ for $m > n$
Tantalizing but maybe dead-end thoughts
Let’s visualize the grid as part of a triangle, with the $(0,0)$ pixel at the top. Letting blue now be represented as $1$ and red $0$ (for a reason that will emerge), the first ten rows are:
                1
               1 1
              1 0 1
             1 1 1 1
            1 0 0 0 1
           1 1 0 0 1 1
          1 0 1 0 1 0 1
         1 1 1 1 1 1 1 1
        1 0 0 1 0 1 0 0 1
       1 1 0 1 0 0 1 0 1 1
Now a different pattern seems to emerge. Starting from the top of the triangle, it appears that each number (apart from the initial $1$) is the sum of the one or two numbers directly above it in the previous row, modulo $2$. That would means that this is a version of Pascal’s Triangle, where the addition is modulo $2$, or, equivalently, it is Pascal’s Triangle modified by replacing every value $n$ in it with $n \mod 2$ (that triangle has an interesting connection to Sierpinski’s Triangle). The first eight rows in fact follow this pattern. But if the whole triangle did so, the overall pattern would look much different, and much less random, with large sub-triangles of red, which we do not in fact see (there is an excellent illustration of what it would look like at that Sierpinski link). Actually this second apparent pattern is broken in the ninth and tenth rows. Still, I remain curious about this. Perhaps the pattern relates to Pascal’s triangle in some other way?
Generating the data (Python)
# Size of square grid
N = 100

Grid = {}

for row in range(N):
	Grid[row,0] = 1
	Grid[0,row] = 1

# We sequentially ascend the diagonals of constant row + column
# Highest sum is 2*N - 2.
for rowPlusCol in range(2,2*N-1):
	# starting row is the larger of 1 and the row where this diagonal intersects column N-1
	# end row is the smaller of rowPlusCol - 1 and the top row, which is N-1
	for row in range(max(1,rowPlusCol - (N - 1)) , min(rowPlusCol-1,N-1) + 1):
		col = rowPlusCol - row
		if col >= row:
			Grid[row,col] = 1 - Grid[row, col - row]
		else:
			Grid[row,col] = 1- Grid[row - col, col]

for row in range(N):
	rowText = ""
	for col in range(N):
		rowText += str(Grid[row,col]) + ","
	print (rowText[:-1])